We've been working on a number of different projects this month, and thought we'd share with you an issue we encountered (and our solution) with one of them.
One of our ongoing projects with Fisheries New Zealand (part of New Zealand's Ministry of Primary Industries) is developing a method for assessing the level of impact that a population can sustain, while maintaining a management objective for the population. This involves defining a demographic model for the species (and population) of interest, then use the model to simulate how population size is expected to change over time for both an unimpacted, and impacted scenario, then examine the difference. As part of the simulations we wanted to include both demographic and environmental stochasicity, which involves generating random values from various distributions.
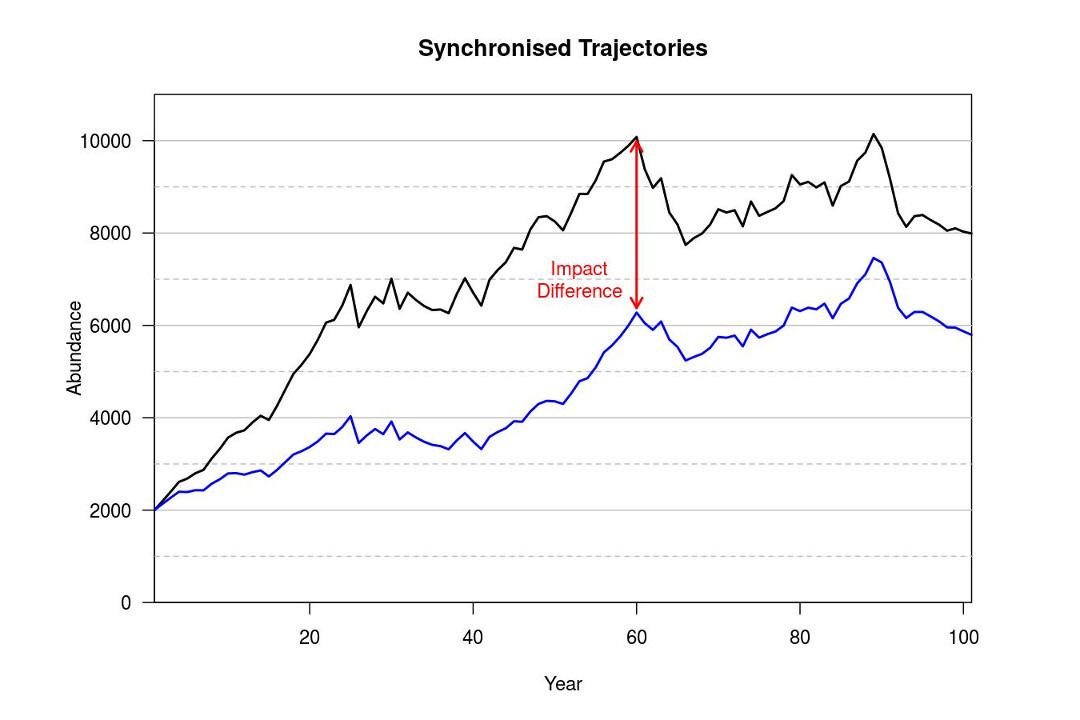
We are using R to develop and run the simulations. If you run the unimpacted scenario then the impacted scenario, you end up with two independently generated population trajectories, similar to Figure 1. Obviously, abundance in the impacted scenario (blue line) is lower on average, but 'good' and 'bad' years do not occur at the same time, which can create some issues when assessing the level of impact (particularly if the impact is expected to be small). This is due to a different sequence of random values being used for each scenario. What we wanted, was something like Figure 2, where the trajectories are synchronised so that the 'good' and 'bad' years occur at the same point in the simulation.

Figure 1

Figure 2
About now, some people will be thinking that we just need to specify the same 'seed' value when starting each simulation so that the same sequence of random values will be used, and those people are half-right. This was our initial attempt as well, except that it didn't entirely work. The issue is that when simulating the demographic processes, we were generating random values from binomial and multinomial distributions, and that in some cases the sample size (i.e., total numbers of 'draws') for these distributions was 0. R is clever (or more accurately, R's coders were clever) and if the sample size is 0, there is no need to generate a random value as 0 is the only possible observation. Therefore, just returning the value of 0 will result in more efficient code.
However the impacted scenario was going to have a greater number of situations where the same size was 0 (because individuals were being removed from the population), which meant fewer random values would be generated. Hence the sequence of random values would be different for each scenario, even when the same seed value is specified. We found that when we specified the same seed value for each scenario, the trajectories would be synchronised initially and then switch to being independent at some point.
After some head-scratching, and trial and error, we identified that R was being too helpful when the sample size was 0, and implemented a solution to ensure that the same number of random values were always be generated, regardless of sample size. While the code is less efficient, and takes longer to run, this guarantees that the same sequence of random values is used for each scenario, for a given seed value. Therefore, we were able to generate synchronised trajectories for any scenario.
We are nearing the end of this project and are currently developing a Shiny app for Fisheries New Zealand staff that will allow them to specify a demographic model for a range of species and evaluate the impact on the population under a range of circumstances. Whether the app is made public or not will be up to them.